A t-test compares two groups; ANOVA compares three or more. See in R why they’re the same test for two groups, and why you shouldn’t run many t-tests instead of one ANOVA.
Author
Rverse Analytics
Published
June 20, 2026
They feel like different tools, but a t-test and one-way ANOVA are the same idea at different scales. Knowing the relationship keeps you from a classic mistake. (Not sure which test fits your design? Try our which-test tool.)
The rule
Two groups → two-sample t-test.
Three or more groups → one-way ANOVA.
They agree for two groups
For exactly two groups, ANOVA’s F equals the t statistic squared — same p-value, same conclusion:
The two numbers match — a t-test is just ANOVA with two groups.
Why not many t-tests?
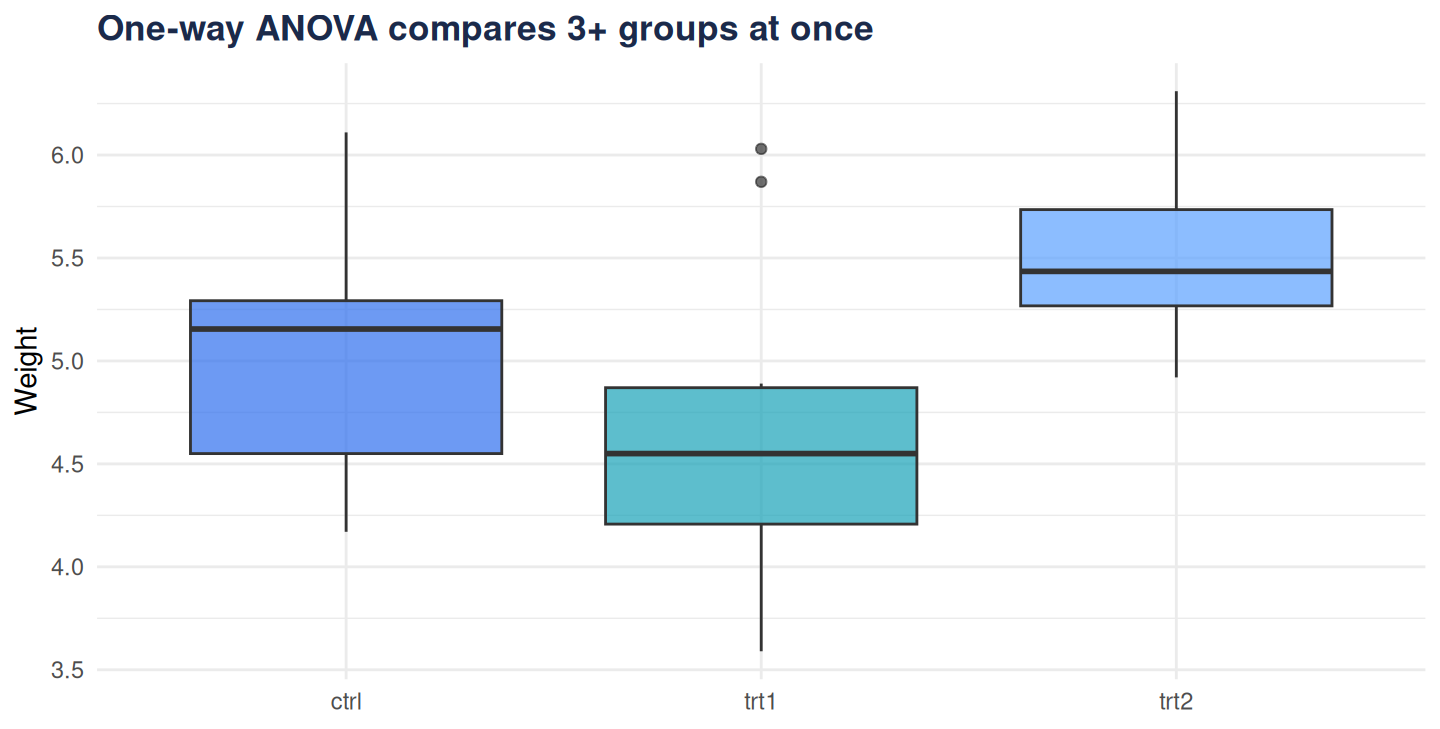
With three groups you might be tempted to run A-vs-B, A-vs-C, B-vs-C. Don’t: each test carries a 5% false-positive risk, so three tests push your overall error rate well above 5%. ANOVA asks “is there any difference?” in a single test at the right error rate.
library(ggplot2)ggplot(PlantGrowth, aes(group, weight, fill = group)) +geom_boxplot(alpha =0.7, show.legend =FALSE) +scale_fill_manual(values =c("#2f6fed", "#17a2b8", "#5aa0ff")) +labs(title ="One-way ANOVA compares 3+ groups at once",x =NULL, y ="Weight") +theme_minimal(base_family ="sans") +theme(plot.title =element_text(face ="bold", colour ="#1b2a4a"))
Figure 1
After a significant ANOVA
ANOVA tells you a difference exists, not which. Follow up with a post-hoc test that controls for multiple comparisons — see one-way ANOVA with post-hoc tests in R.