library(ggplot2)

theme_rverse <- function(base_size = 12) {
  theme_minimal(base_size = base_size) +
    theme(
      plot.title = element_text(face = "bold", colour = "#1b2a4a",
                                size = rel(1.15)),
      plot.subtitle = element_text(colour = "#5a6478",
                                   margin = margin(b = 10)),
      plot.title.position = "plot",
      axis.title = element_text(colour = "#1b2a4a"),
      panel.grid.minor = element_blank(),
      panel.grid.major = element_line(colour = "#e4e8f0"),
      legend.position = "bottom",
      strip.text = element_text(face = "bold", colour = "#1b2a4a")
    )
}

scale_colour_rverse <- function(...) {
  scale_colour_manual(values = c("#2f6fed", "#17a2b8", "#1b2a4a",
                                 "#e8590c", "#6f42c1"), ...)
}Write your ggplot2 theme once, use it everywhere
ggplot2
workflow
A ten-line theme function is the cheapest branding investment an analytics team can make. Here is ours, and how to set it as a session default.
Open any report produced by a team without a shared plotting theme and you can tell which analyst made which figure — different fonts, different greys, different grid lines. The fix is a theme function: written once, applied everywhere, versioned like any other code.
A complete theme in one function
Before and after
The same plot, the same code — the only difference is the final line.
p <- ggplot(iris, aes(Sepal.Length, Petal.Length, colour = Species)) +
  geom_point(alpha = 0.75) +
  labs(title = "Default ggplot2 look",
       subtitle = "Grey panel, default palette, top-left legend nowhere in particular",
       x = "Sepal length (cm)", y = "Petal length (cm)")
p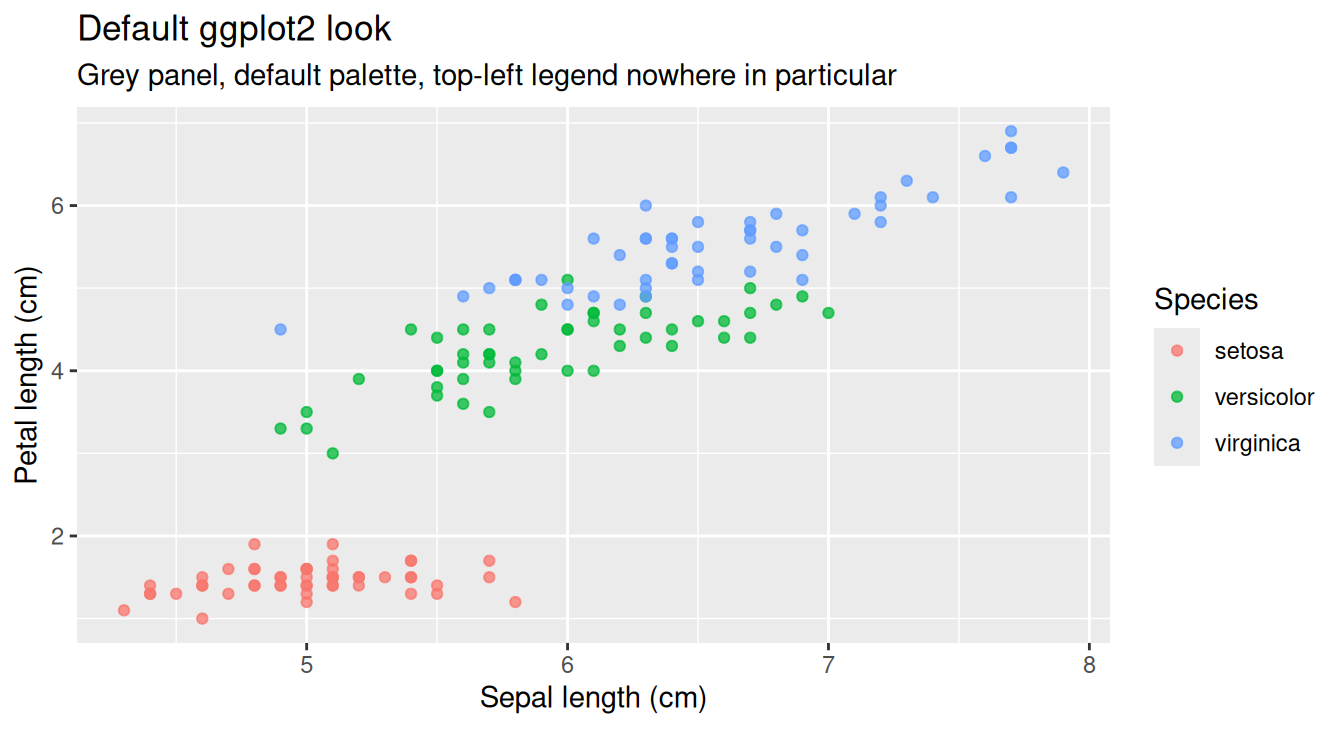
p +
  labs(title = "With theme_rverse() and the brand palette",
       subtitle = "One added line — typography, grid and colours now match every other figure") +
  theme_rverse() +
  scale_colour_rverse()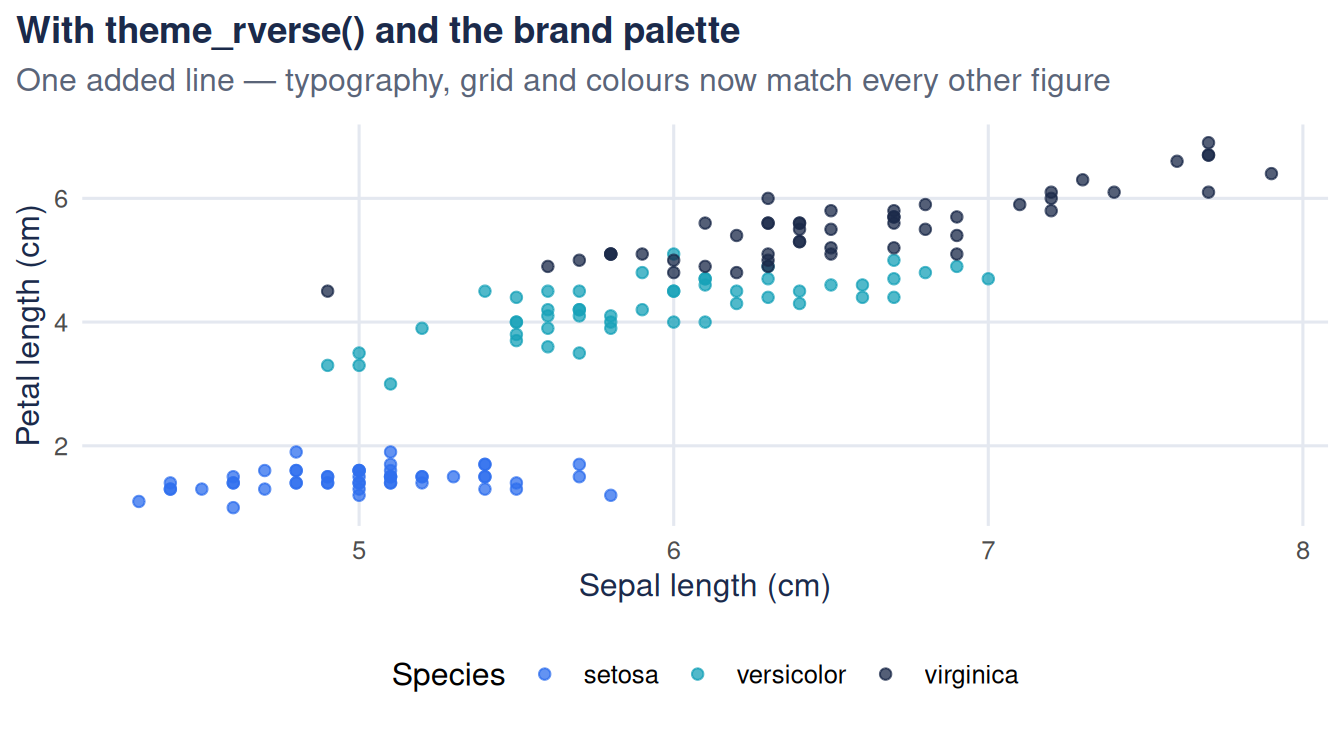
Make it the default
The step most teams skip: you don’t have to add + theme_rverse() to every plot. Set it once at the top of the script or in a package .onLoad():
theme_set(theme_rverse())
options(ggplot2.discrete.colour = scale_colour_rverse)
From that line on, every ggplot in the session is on-brand by default — and when the brand changes, you update one function, re-render, and every figure in every report follows.
Where to keep it
- One project? A
R/theme.Rfile sourced at the top of the analysis. - A team? An internal R package (
yourorg.theme) — install once,library()everywhere. This is exactly the kind of small internal package we build in our package development service.